
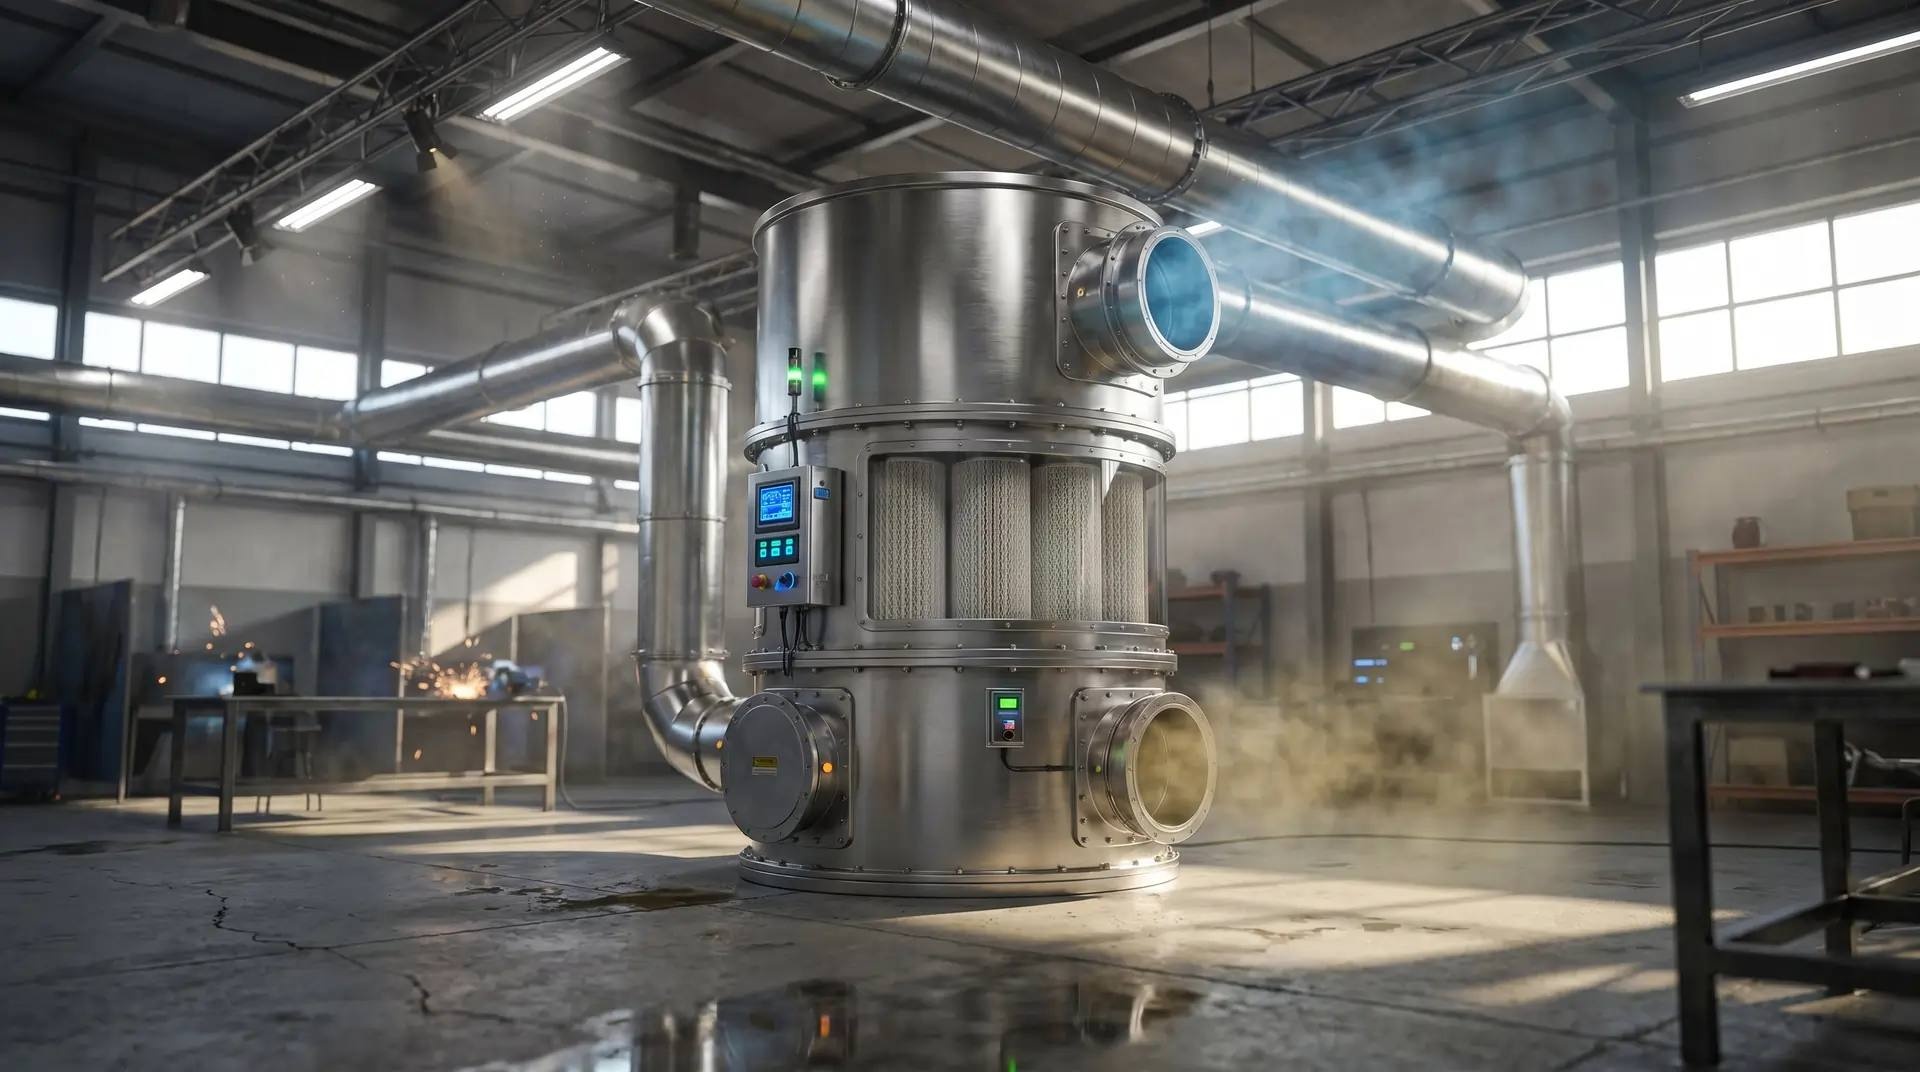
What Is a Filter Loading Curve?
If you buy or specify air filters, it is easy to focus on the initial rating and overlook what happens after the filter goes into service. A filter loading curve helps fill that gap by showing how a filter’s resistance changes as it collects dust over time. For mechanical contractors and industrial buyers, that makes it much easier to compare filter behaviour in real operating conditions, not just on paper.
What a filter loading curve shows
A filter loading curve is a graph that tracks how a filter performs as dust builds up on the media. In simple terms, it shows the relationship between dust loading and pressure drop.
As a filter collects particles, air has to work harder to pass through it. That extra resistance is measured as pressure drop. A loading curve shows whether that pressure drop rises gradually, rises quickly, or stays relatively stable for longer before climbing.
That matters because two filters can start with a similar rating, but behave very differently once they are installed in a real system. One may hold dust more evenly and stay usable for longer. Another may load up quickly, increasing resistance sooner and putting more strain on the system.
A loading curve can help answer questions such as:
- •How fast will the filter resistance increase?
- •Does the filter load evenly across the full media area?
- •Is there a sharp rise in pressure drop near the end of service life?
- •How does the filter behave under the dust conditions at your site?
Why buyers should care about the curve, not just the rating
Initial efficiency or media grade is only part of the picture. A filter with a suitable rating may still be a poor fit if it loads too fast for the application.
For commercial and industrial systems, a filter loading curve helps with practical decisions such as:
- •selecting a filter for a high-dust environment
- •matching pre-filters and final filters so the system stages work well together
- •understanding when a filter may need inspection based on pressure drop trends
- •balancing airflow needs with dust capture over the life of the filter
This is particularly useful where access is limited, the system runs for long periods, or the dust load changes through the day or week. In those situations, the curve gives a clearer picture of how the filter is likely to behave between inspections.
A loading curve can also help when comparing different filter constructions. Pleat depth, media type, media area, frame design and sealing quality can all affect how dust is held and how resistance rises over time.
How to read a loading curve in practical terms
You do not need to be a laboratory technician to use a loading curve well. A basic reading of the curve can still tell you a lot about whether a filter suits the job.
The starting point
The curve usually begins with the clean filter resistance. This is the pressure drop when the filter is new and before it has collected significant dust.
A lower starting resistance can be useful, but it should not be the only deciding factor. A filter that starts low but loads rapidly may create more operating issues than a filter that starts slightly higher and stays stable longer.
The slope of the curve
The slope shows how quickly resistance increases. A steep curve means the filter is loading fast. A gentler curve means the filter is handling dust more gradually.
In practice, a gentler curve can make system behaviour more predictable. That does not mean every site needs the same curve shape. The right curve depends on airflow, dust type, run time, access for maintenance and the downstream equipment.
The end of service behaviour
Some filters rise gradually for most of their life and then climb sharply near the end. Others may show early loading and steady resistance growth.
That end-stage behaviour matters because it can influence how much warning you get before the filter needs attention. Where gauges are fitted, monitoring pressure drop is one of the most useful ways to track this.
What affects a filter loading curve
A filter loading curve is not fixed in the abstract. It depends on the filter design and on the conditions it faces in service.
Filter construction
Different media and frame designs load differently. Factors that can affect the curve include:
- •media area
- •pleat spacing and depth
- •media fibre structure
- •surface treatment
- •sealing and frame construction
A well-designed filter can spread dust across more of the media and delay a rapid pressure rise.
Dust type and site conditions
Fine dust, fibrous material, sticky particles and variable dust bursts can all affect loading behaviour differently. A dry indoor commercial environment is not the same as a workshop, processing area or plant room with heavier dust exposure.
The way air moves through the system also matters. Uneven airflow, poor sealing or bypass around the filter can distort the curve in real use, because the filter may not be loading as intended.
Filtration stage and system design
In many systems, the loading curve makes more sense when viewed as part of the full filtration package. A pre-filter can take the first hit and protect the final filter from loading too quickly. That can make the overall system easier to manage.
If you are planning a new installation or changing a filter arrangement, it is worth looking at the full system rather than choosing each element in isolation. You can see our our products page for a broader view of filter types, or custom air filters if the installation needs a made-to-measure solution.
How loading curves support maintenance planning
Filter inspection frequency depends on the system, site conditions and dust load. It is best to follow the filter and equipment manufacturer instructions and monitor pressure drop where gauges are fitted.
That is where the loading curve becomes useful beyond selection. If you know how a filter tends to load, you can make more informed decisions about when to inspect it and what to expect as dust accumulates.
A loading curve helps you:
- •set realistic maintenance expectations
- •compare replacement options before committing to a product
- •identify whether a filter is underperforming in a specific site
- •plan around pressure drop trends rather than guesswork
This is especially helpful for mechanical contractors who need to balance access, airflow requirements and practical service routines. It is also useful for industrial buyers managing multiple systems with different dust conditions.
If a site uses ventilation systems under AS 1668.2:2024, confirm site requirements with the mechanical services engineer or building owner before changing filter arrangements.
Choosing the right filter with the loading curve in mind
A loading curve is not the only specification that matters, but it is one of the most useful when you want a realistic picture of in-service behaviour.
When comparing options, ask for information about:
- •initial resistance
- •expected loading behaviour
- •media type and construction
- •filter dimensions and fitment
- •whether the product is intended for coarse, finer or final filtration stages
If you are measuring an existing filter for replacement, accuracy matters. Our guide on how to measure an air filter may help when you are confirming size before ordering.
It is also important not to assume rating systems convert directly. MERV, EN 779 and ISO 16890 do not convert one-to-one, and G3/G4/F5-F9 are EN 779 classes that are still widely used in Australia even though EN 779 has been superseded by ISO 16890. If you are comparing products across different rating systems, use the actual product data rather than a simple conversion.
Some filters are designed to be washable - check the product instructions before assuming a filter can be cleaned and reused. Washing a filter that is not designed for it can damage the media or change its performance.
For high-efficiency applications, remember that H13 is at least 99.95% and H14 is at least 99.995% efficient at the most penetrating particle size under EN 1822. Those figures are specific to the standard and should only be used where relevant to the product being specified.
Need help selecting the right filter?
At Total Air Filtration, we are a family-owned air filter manufacturer and supplier in Hillcrest, Brisbane QLD, and we can help match a filter to the way your system actually runs. If you need a standard product or a made-to-measure solution, call 07 3800 3448 or request a quote.
You can also contact us or explore filter servicing and commercial filter servicing if you want support with ongoing maintenance and replacement planning.
Written by
The Total Air Filtration Team
General information only — always follow the instructions for your filter and system. Have questions about this article? We're here to help.